·4 min read
Who's offline in America
I asked Claude to map internet use in every US state. It came back with two federal surveys, six maps and three memes.
- ai-research
- data
- maps
On this page
This one's different. I didn't write it, and I didn't make the maps.
I gave Claude one sentence: make a map of the United States showing internet usage by state, and do deep research. Everything below came out of that. The research, the numbers, the maps, the memes, this text. My job was to ask for things and check they were true.
Here's what it found.
Two surveys, two questions
"Internet usage" sounds like one number. It's two.
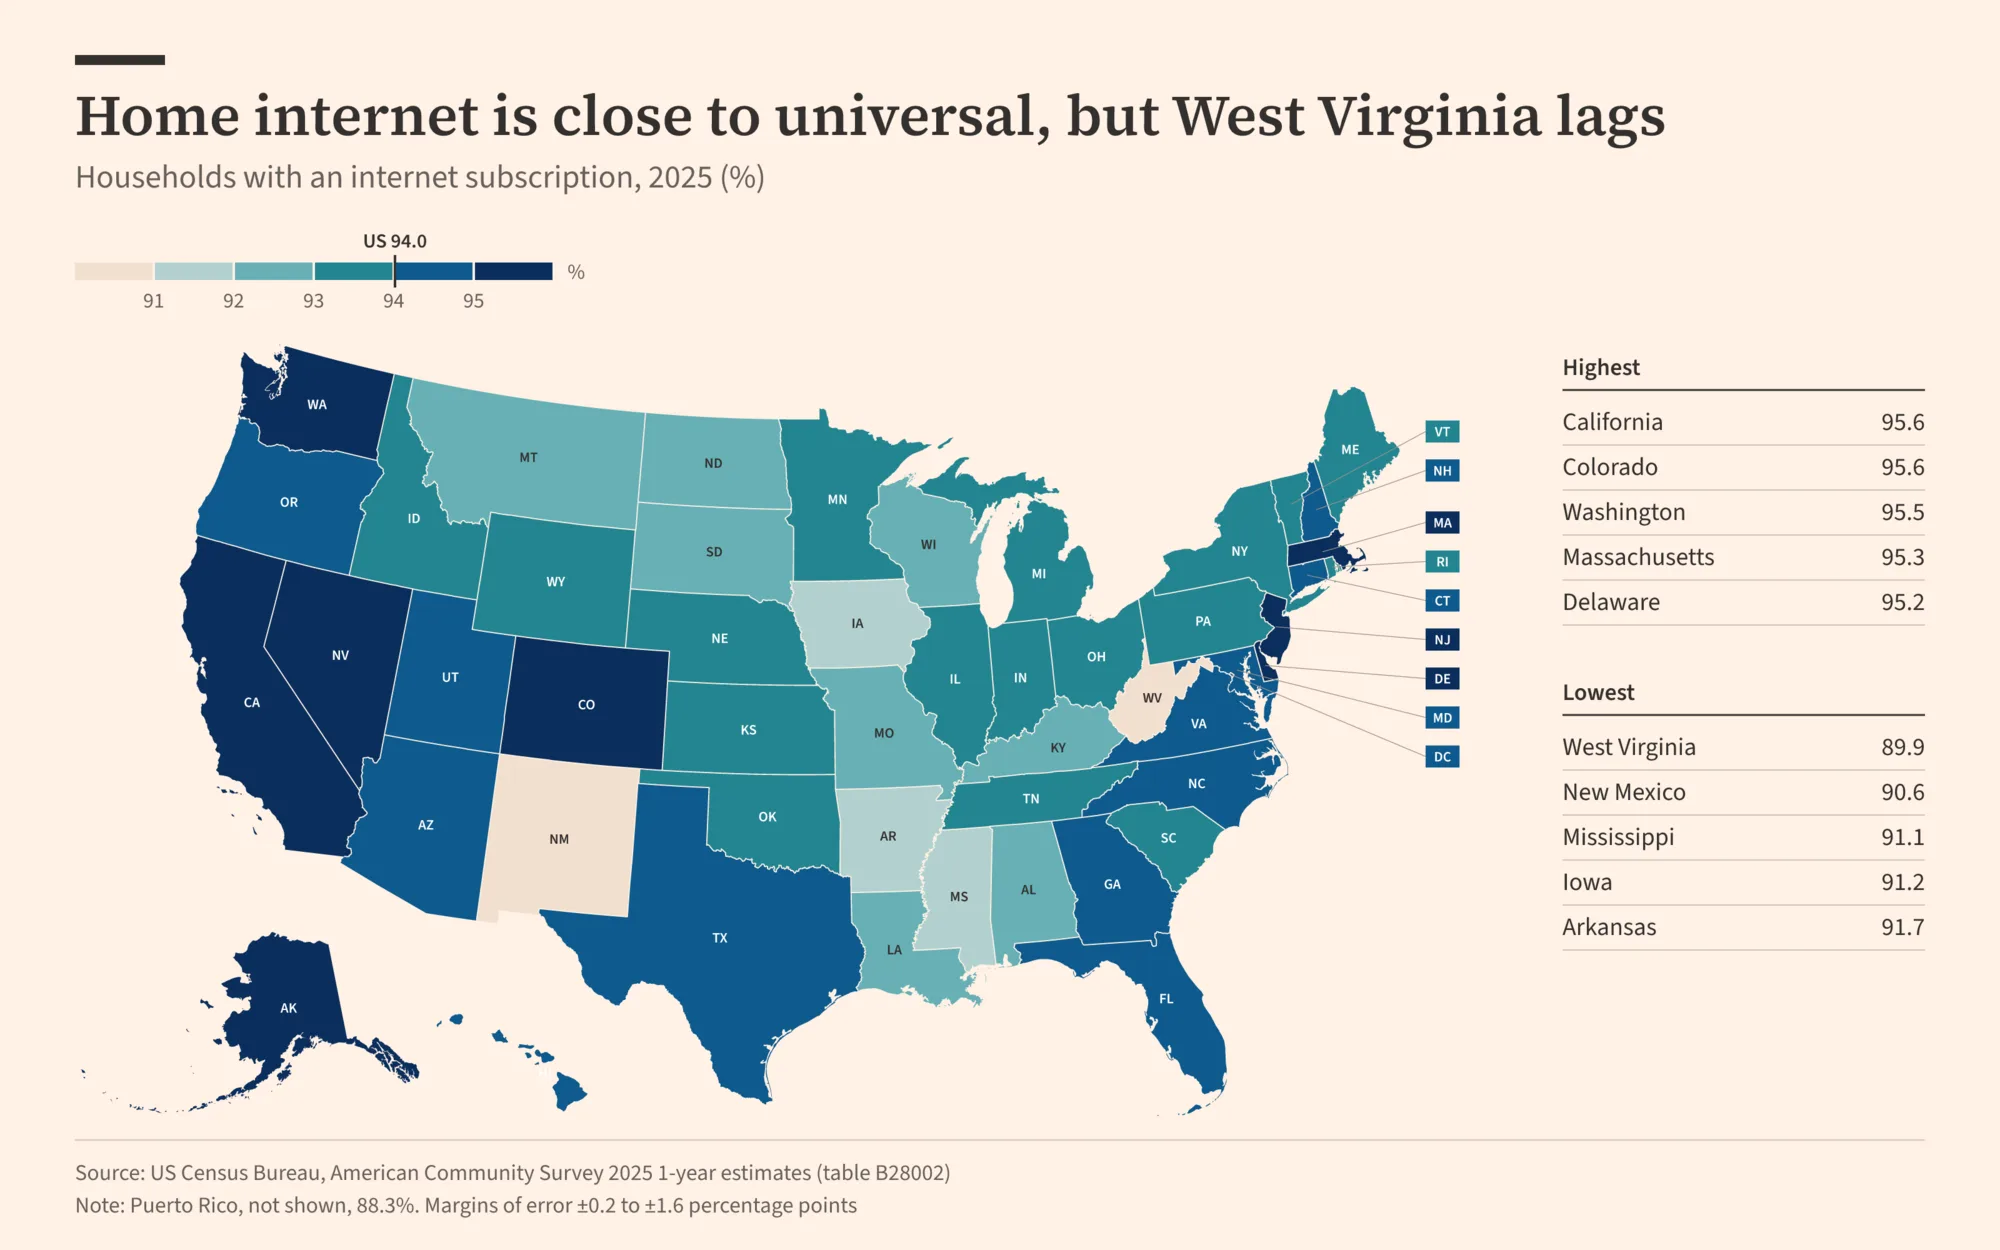
The American Community Survey goes to about 3.5 million addresses a year and asks each household whether it pays for internet, and what kind. The 2025 numbers came out this fall. The sample is huge, so state figures are tight, usually within a point.
The NTIA Internet Use Survey rides along with the Census Bureau's monthly jobs survey every couple of years. It asks people whether they go online, anywhere. It goes back to 1998. The sample is smaller, so state numbers wobble by 1 to 3 points. The latest results are from November 2023. The 2025 round was collected but isn't out yet.
Getting the data took one detour. The Census API now wants a key. Claude didn't stop to ask me for one.
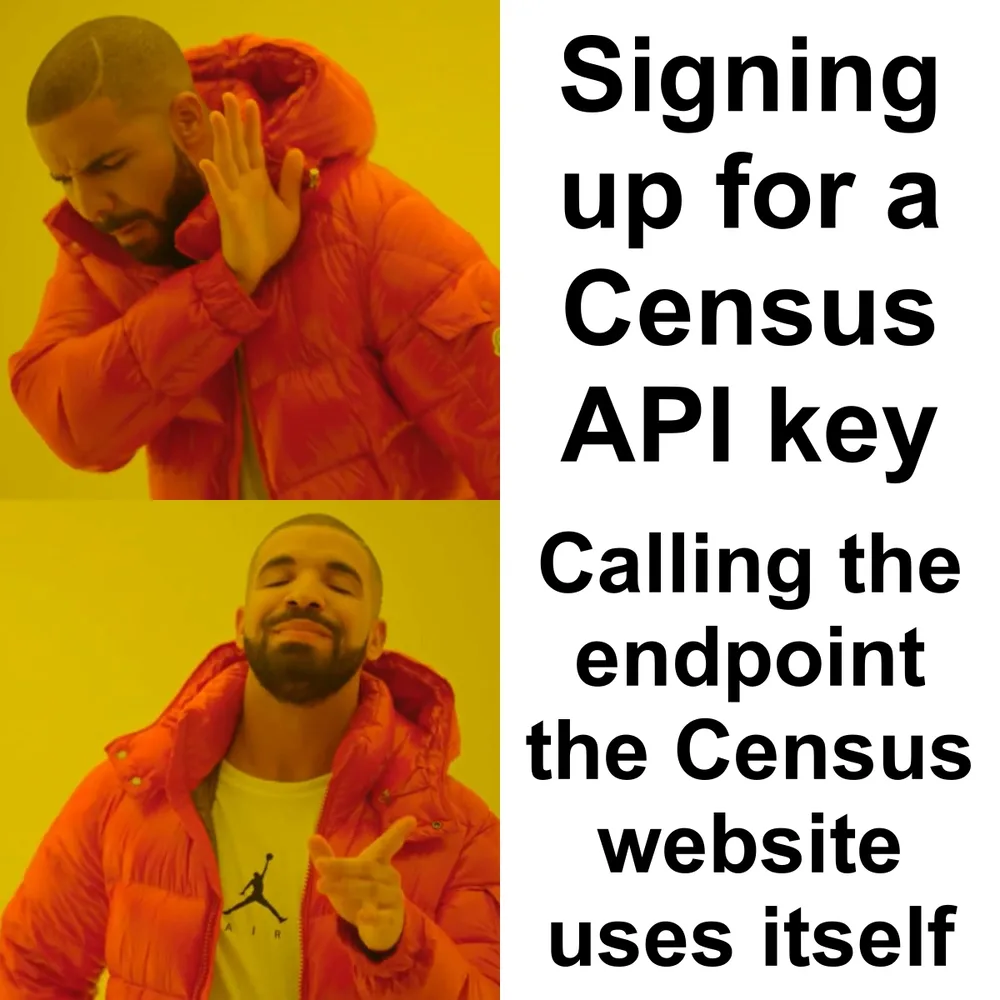 data.census.gov loads its tables from a public JSON endpoint. That one doesn't ask.
Almost everyone pays for internet now
94.0% of US households have an internet subscription. That's about 126 million homes, up from 93.3% in 2024.
The gap between states is small. Colorado and California lead at 95.6%. West Virginia is last at 89.9%, then New Mexico (90.6%) and Mississippi (91.1%). Puerto Rico, which isn't on the map, sits at 88.3%.
Small gap, dramatic map. The color scale only runs from 89% to 96%, so neighbors look more different than they are.
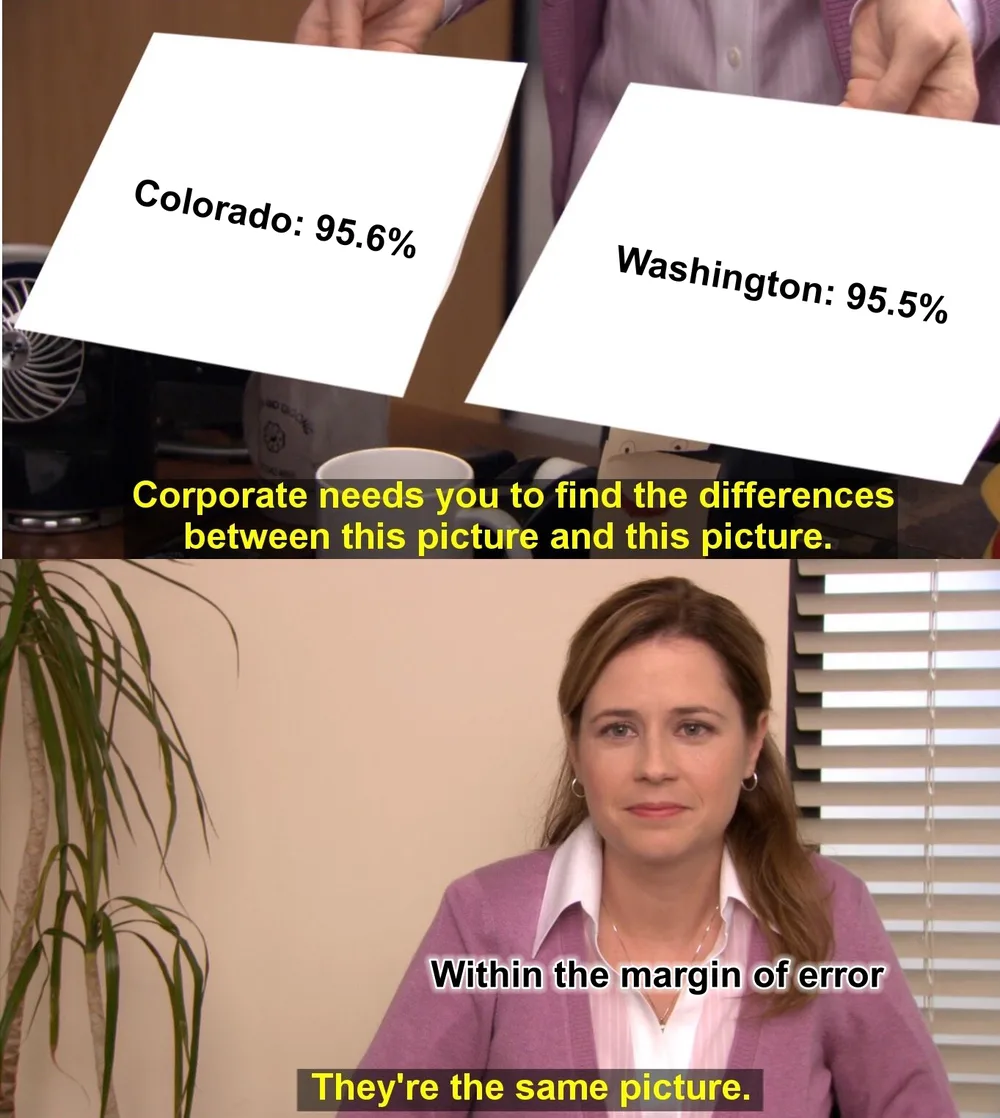 Colorado's margin of error is ±0.5 points. Washington's is ±0.4.
How people connect
Most homes still have a wire. 76.6% of households have cable, fiber or DSL. New Hampshire leads at 84.0%. Alaska is last at 66.6%, then Mississippi and West Virginia, both at 68.6%.
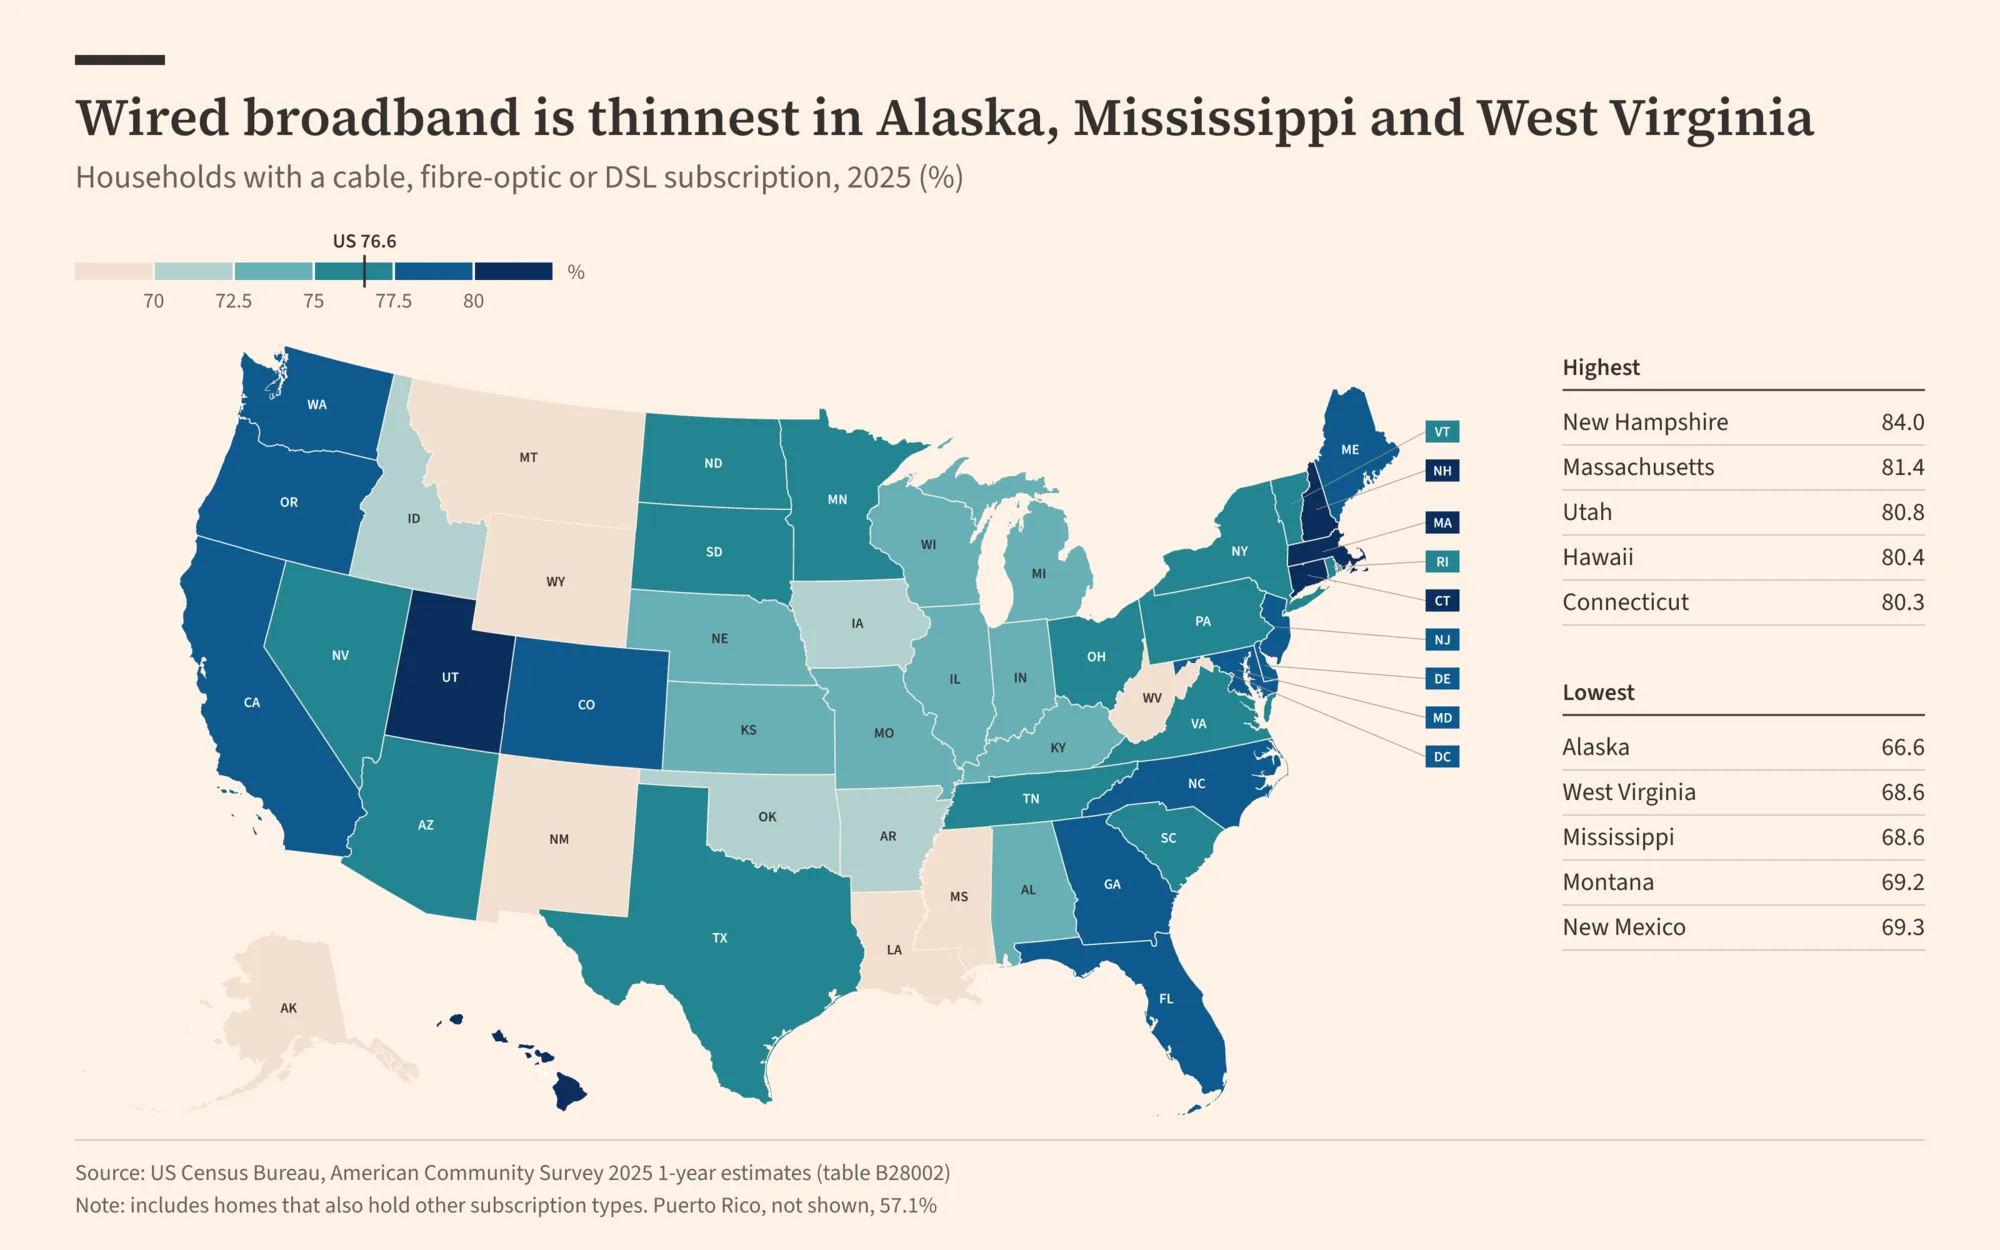
Where the wire doesn't reach, the sky does. 16% of Alaska households have satellite internet, and Wyoming, Idaho and Montana are all above 12%.
The next map is the one that surprised me. 13.1% of US households, about 17.6 million, have a phone data plan and nothing else. No home broadband. Just the phone.
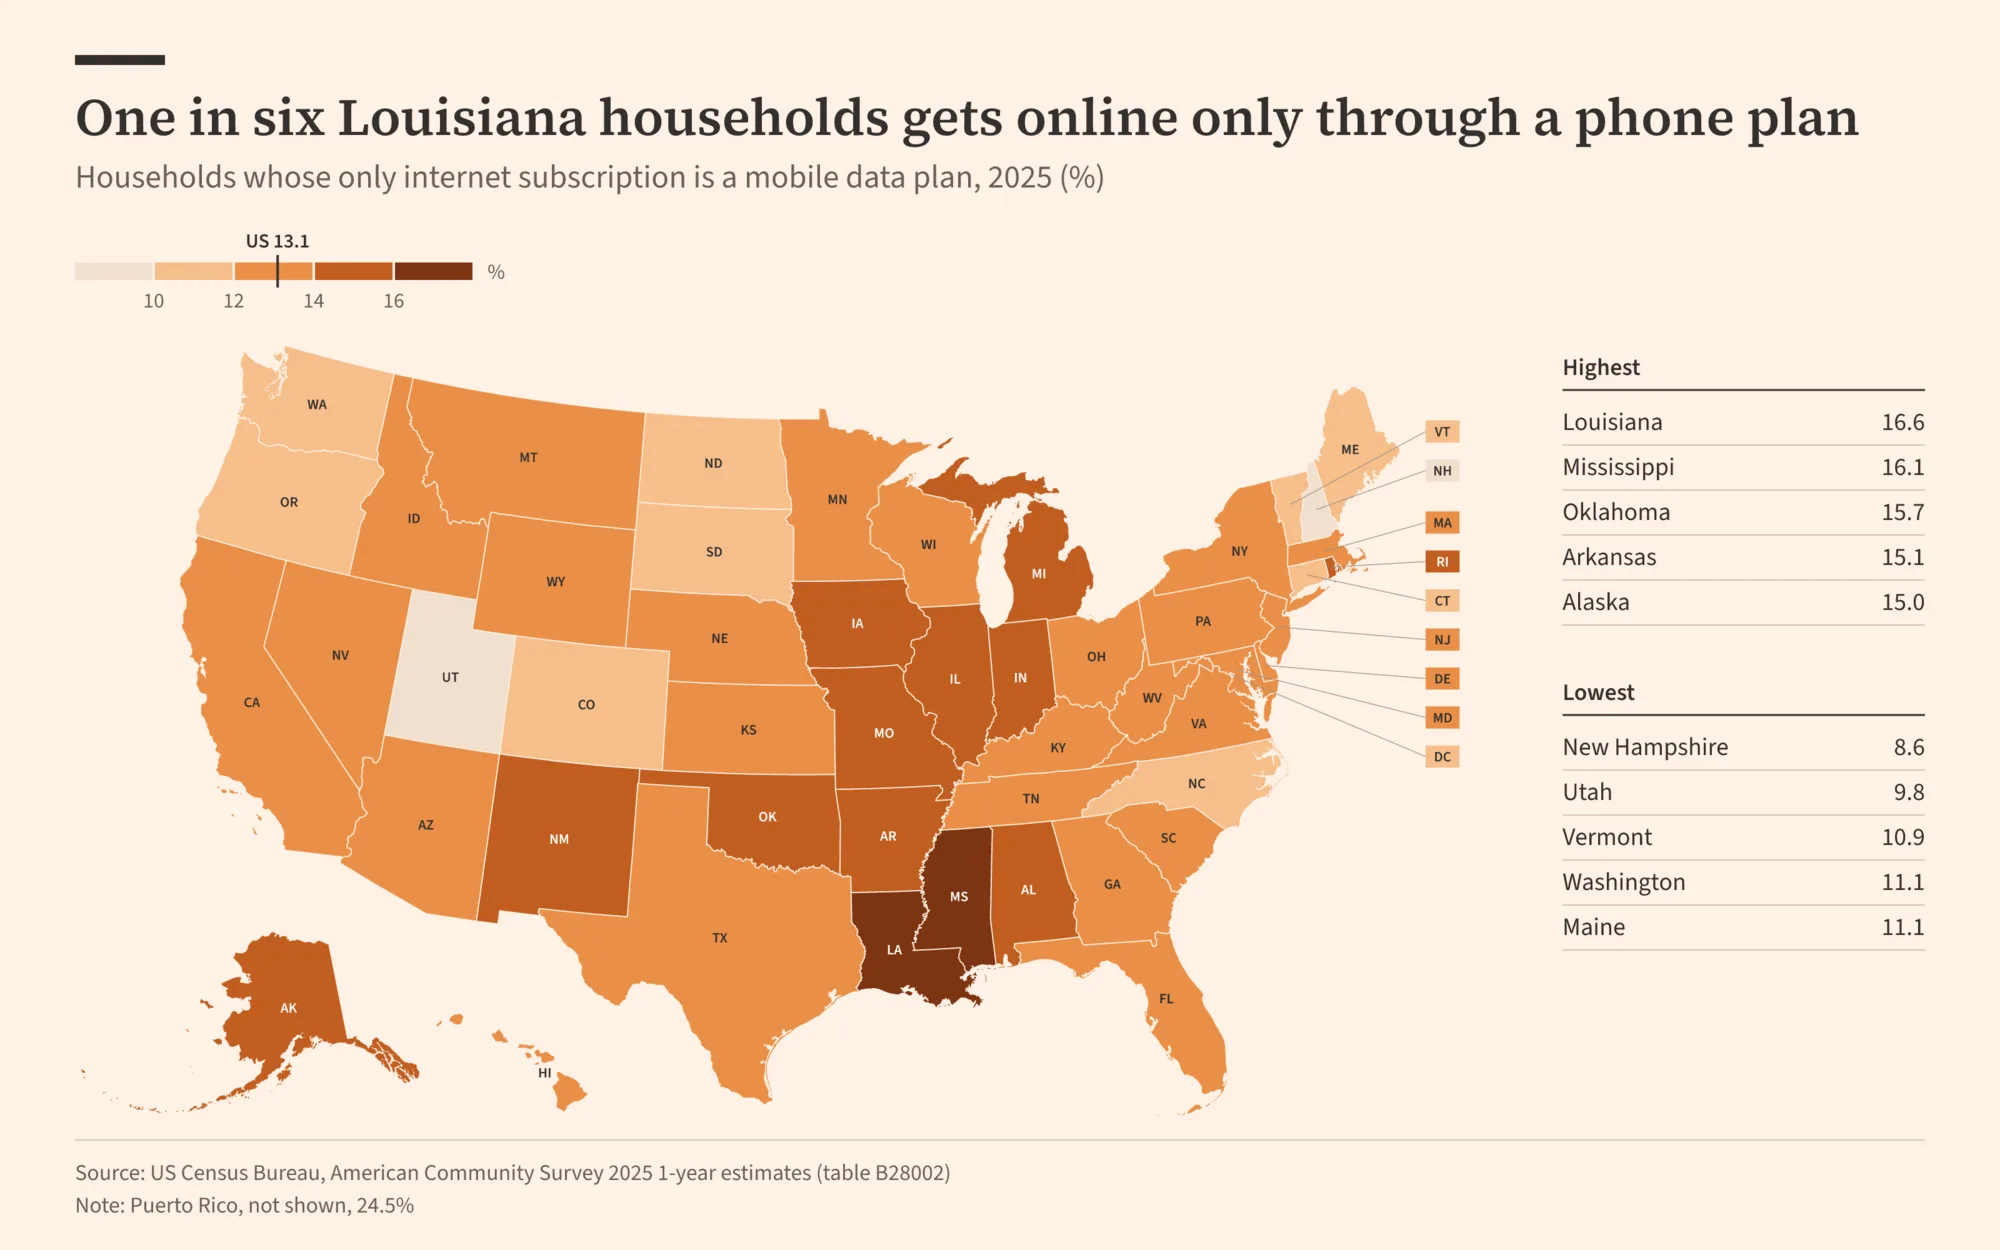
In Louisiana that's one home in six (16.6%). Mississippi, Oklahoma and Arkansas aren't far behind. New Hampshire has the fewest, at 8.6%.
The survey doesn't ask why. Maybe it's price. Maybe the phone is good enough. Either way, try filling out a job application on one.
Who's still offline
4.0% of households have no internet at all. No subscription, no free access from a landlord or a school. That's about 5.4 million homes.
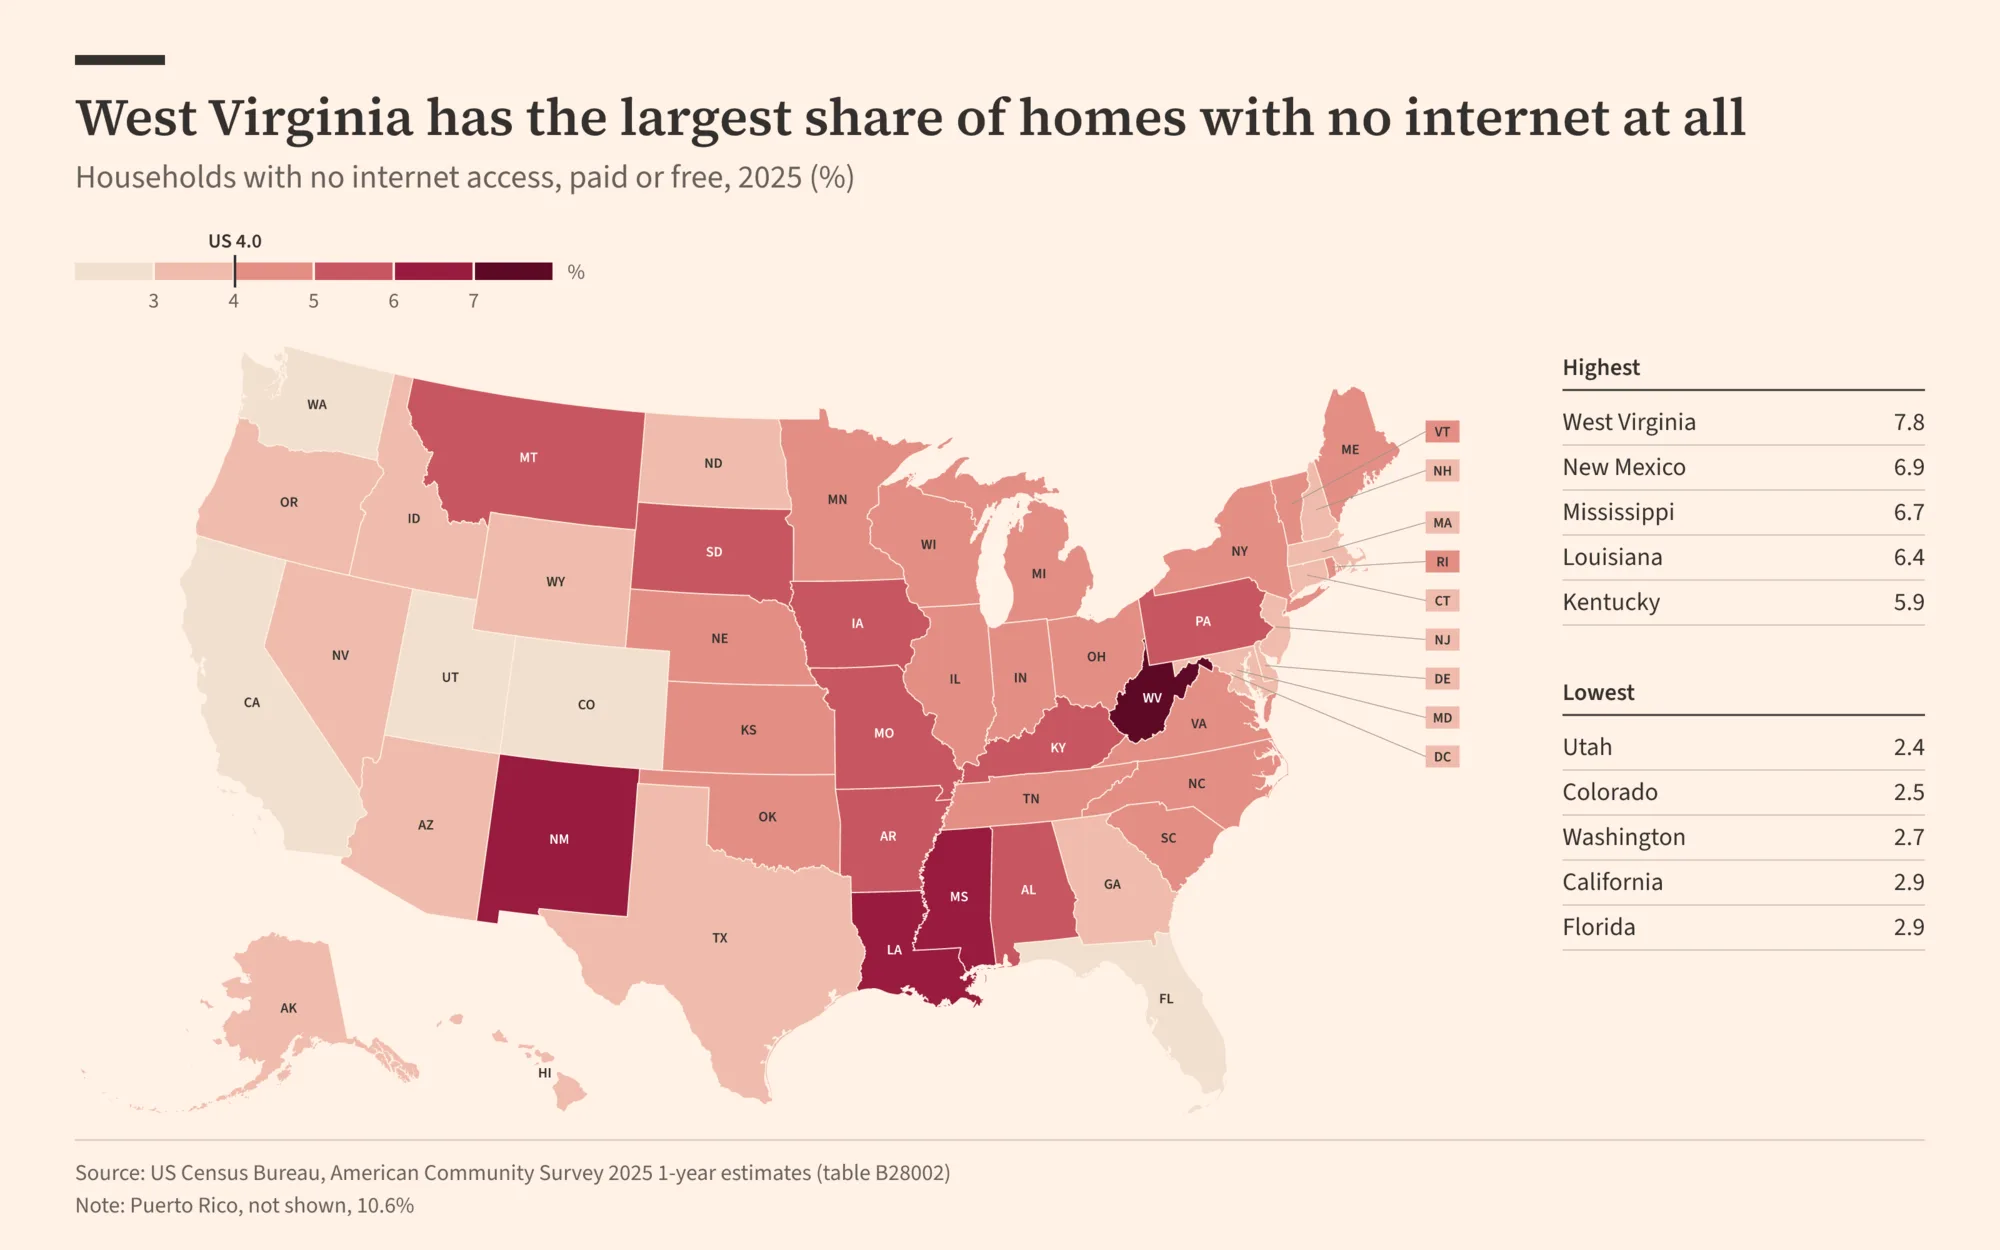
West Virginia is first again, at 7.8%. Then New Mexico (6.9%), Mississippi (6.7%) and Louisiana (6.4%). Utah (2.4%) and Colorado (2.5%) have the fewest offline homes.
You've probably noticed the same names coming back. Mississippi and Louisiana show up on all three maps: near the bottom for wired broadband, top two for phone-only, top four for offline. Same states, three different angles.
25 years in six maps
My favorite.
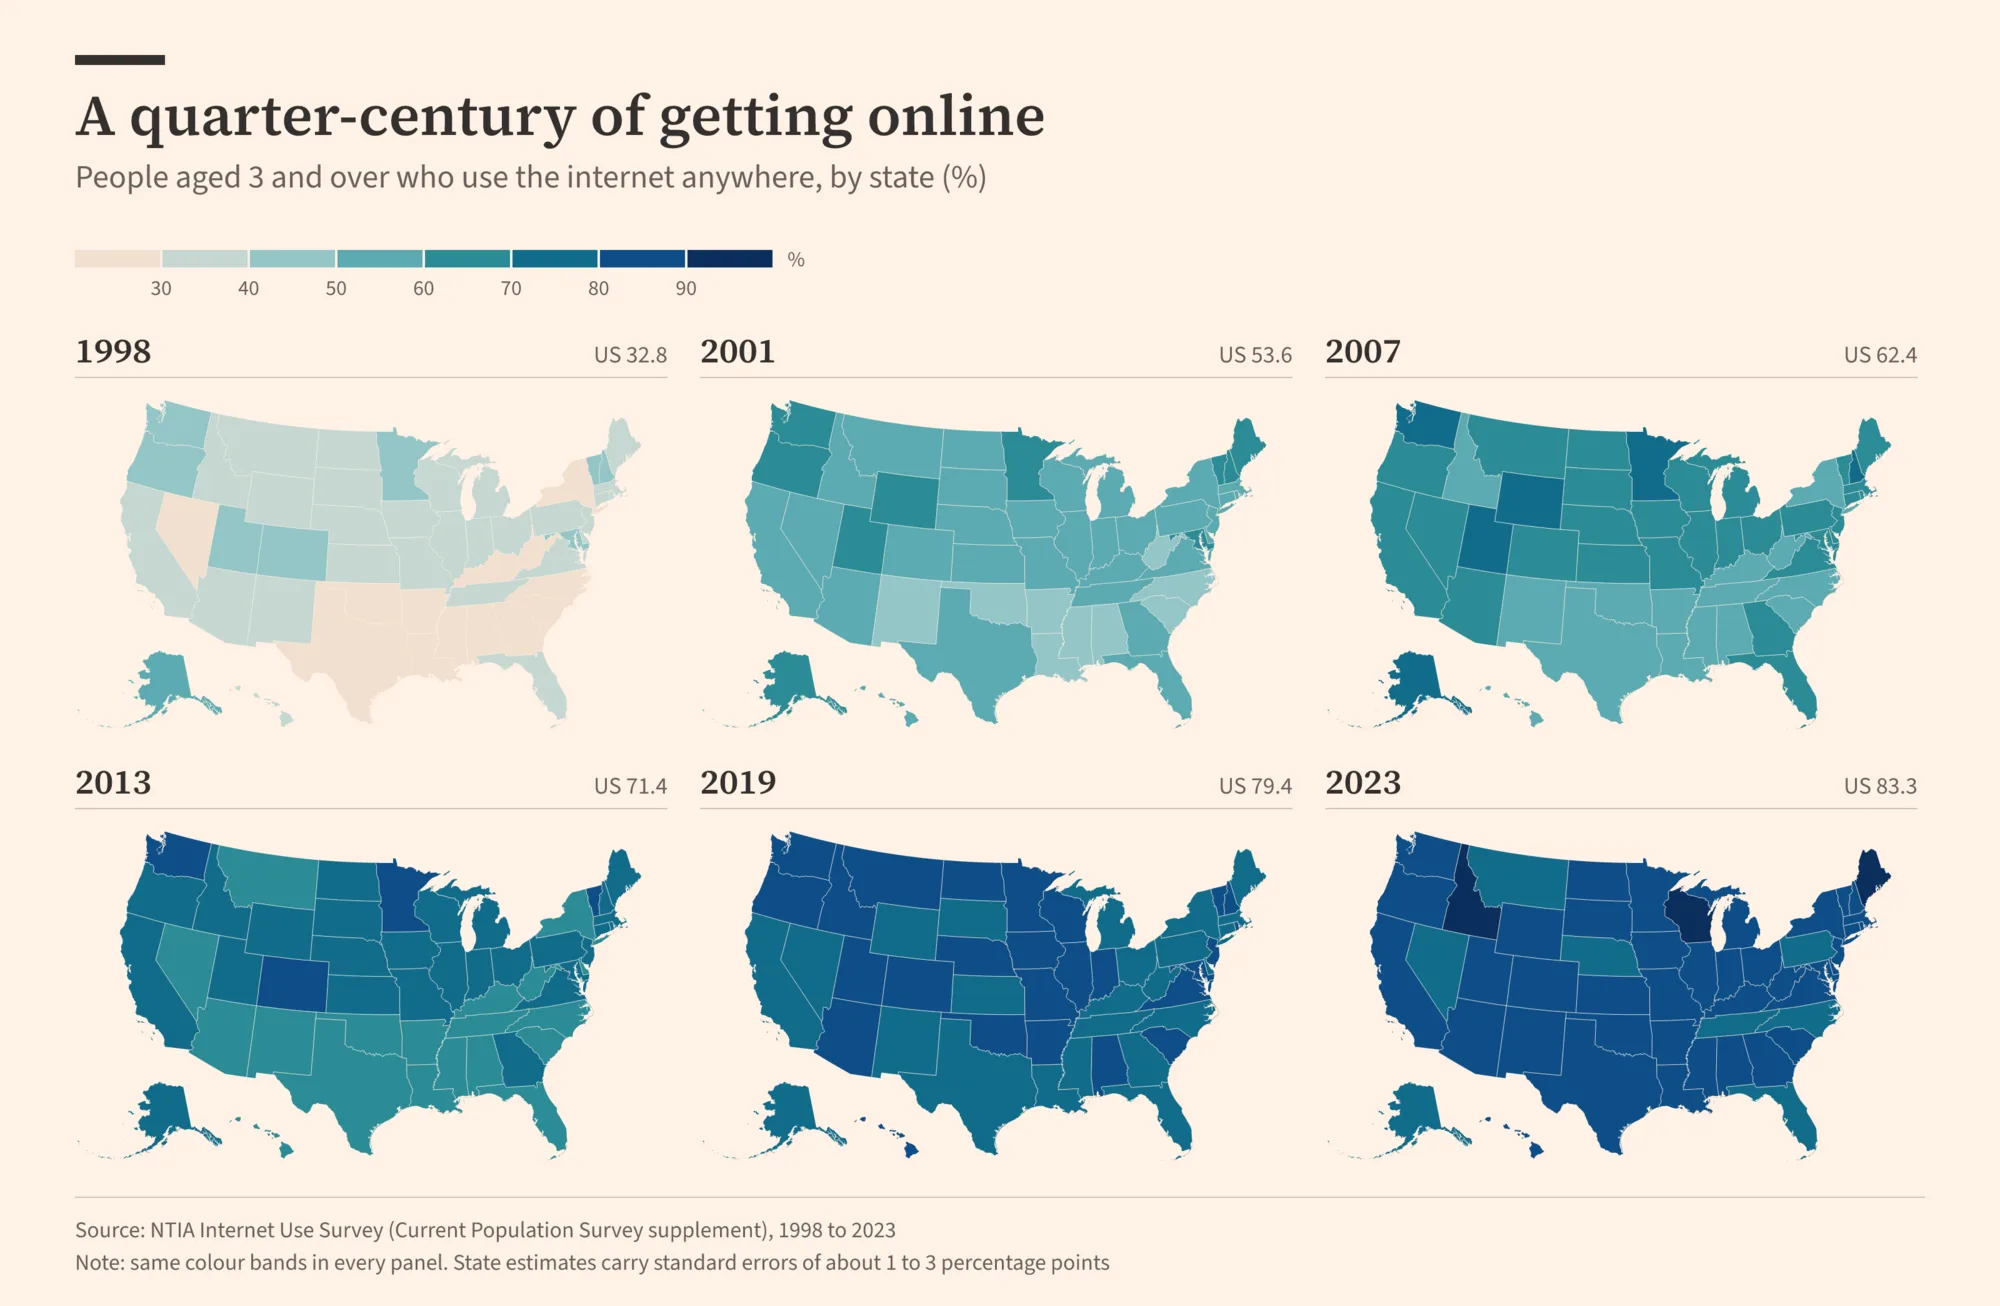
In December 1998, 32.8% of Americans aged 3 and up used the internet. Alaska led at 50.4% (yes, Alaska). Mississippi was at 17.0%.
By 2023 it was 83.3%. Every state got darker. The gap between the top and bottom states went from 33 points to 17.
These numbers run lower than the household ones. They count people, kids included, and ask whether each one actually goes online, not whether the house pays for a connection.
How it got made
Claude pulled both datasets, checked them against each other, built an interactive version of the map, and rendered the images. Then I asked for a Financial Times look. That part took longer than the research.
 Priorities.
The memes come from Hypermeme, my meme app. Claude called its renderer directly, so the captions get the same fonts and layout the app would give them.
Before the headlines went on the maps, Claude checked each one against the numbers. "One in six" is 16.6%. And when a state was only ahead by a tenth of a point, it said so instead of crowning a winner.
Sources
| Data | Source |
|---|---|
| Households online, wired broadband, phone-only, offline (2025) | US Census Bureau, American Community Survey 1-year estimates, table B28002 |
| People online, by state (1998 to 2023) | NTIA Internet Use Survey, via the NTIA Data Explorer |
Both are free and public. If you want to dig in yourself, start with B28002. It has every connection type, for every state, with margins of error.